Armchair Forecaster User Guide
Creating An Account
Creating an Armchair Forecaster account is easy! Click the "Register" link on the home screen or click here to register. You will be asked to create your own unique username and password (note that all usernames must comply with our user agreement), as well as provide a valid email address. This email address will be used to reset your password if needed and send important notifications regarding your account (don't worry, we don't send spam mail!). The most common problem encountered when creating an account is not re-typing your password correctly. If you experience further difficulties creating an account, please submit a bug report and describe your problem. If at any time you would like to delete your account, please send an account deletion request via the contact form.
Forecast Overview
Forecast Goal
Similar to the SPC's convective outlooks, Armchair forecasts aim to convey the probability of a severe weather event ocurring within 25 miles of a point across the contiguous United States over a convective day. A severe weather event is defined as one of the following:
- Any tornado
- Hail 1 inch or greater in diameter
- Wind speeds of 58 mph (50 knots) or greater and/or wind damage
Each class of severe weather event (tornado, hail, wind) is given its own probabilistic forecast, which you, the forecaster, must create!
Forecast Valid Period and Geographic Boundaries
Forecasts are valid from 16:30 UTC on Day 1 to 12:00 UTC the following morning. All severe weather reported during this period is counted towards forecast verification. Consequently, severe weather events that occur during the 12:00 to 16:30 UTC period each day are ignored for verification purposes. The forecast domain covers the entire lower 48 United States, but more specifically, all forecasts must be bound with the latitudes of 24.0 N to 50.0 N and within the longitudes of -66.5 W to -125.0 W.
Forecast Deadline
Each forecast is due at 16:30 UTC each morning. This time was selected to 1) match with the 16:30 UTC update of the SPC Day 1 convective outlook, 2) give forecasters an opportunity to analyze morning observations prior to issuing their forecast. The countdown clock in the top right corning of the web page will inform you of how much time you have remaining to submit your forecast. Forecasts submitted after 16:30 UTC will be valid for the following day. For example, a forecast submitted at 16:00 UTC on July 1st will be valid from 16:30 July 1st to 12:00 UTC July 2nd. A forecast submitted at 16:45 UTC on July 1st will be valid from 16:30 UTC July 2nd to 12:00 UTC July 3rd. This is a strict deadline as automated processes occur at the submission deadline, therefore no extensions can be granted. After 16:30 UTC the forecast you issued will populate into the realtime verification page for live tracking through the remainder of the convective day. At 12:30 UTC, a verification script will calculate your scores and post them to your profile and the leaderboard.
Submitting a Forecast
Step 1: Analyaze weather data
The first step in creating a convective forecast is analyzing current weather conditions and utilizing forecast models. This step is entirely up to you! Each forecaster has their own methodology for analyzing the atmosphere, but to get you started we've included some basic forecasting philosophy and links to weather data down below. When you're ready to begin creating your Armchair forecast, click on the "Forecast" button.
Step 2: Choose your line type
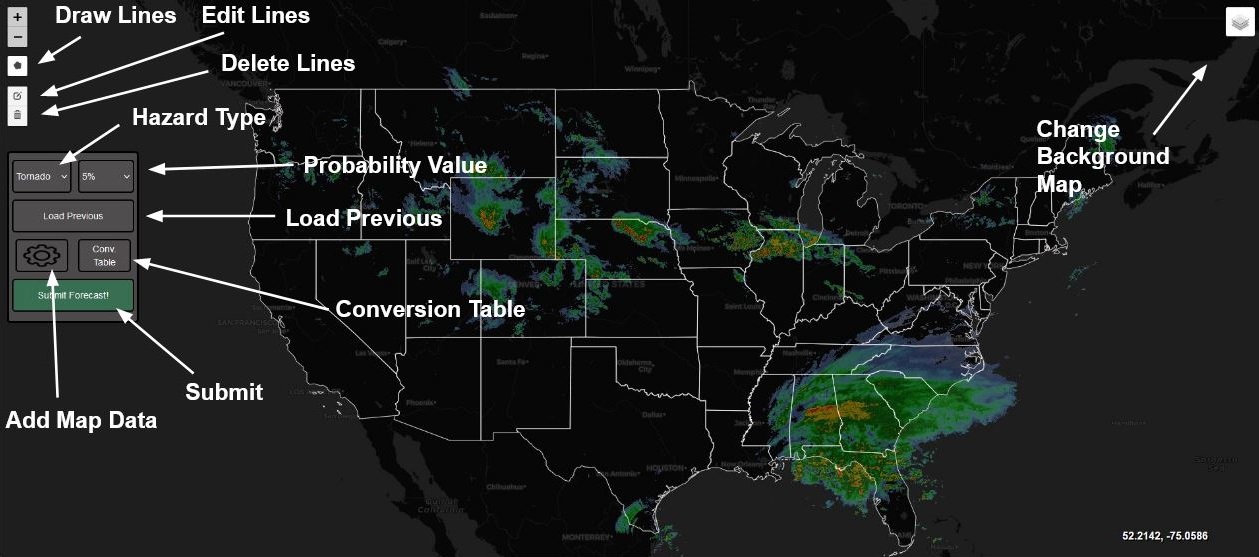
On the right side of the forecast submission page, click the hazard selection button to choose which of the three hazards you want to create a forecast for. Note that you do not necessarily have to draw forecast lines for each hazard - or even any hazard! By not drawing lines you are implying that you do not believe that the selected hazard will occur.
Step 3: Choose your probability value
Under the hazard selection box, the probability value of your forecast line can be selected. The probabilities for each hazard correspond to the probabilities employed by the SPC. Not only does this allow forecasters to compare their forecasts to the official SPC outlook, but a conversion table (accessed by clicking the "Conv. Table" button) helps assess how their probabilistic forecast would translate categorically. Continuous probabilities must be maintained for each hazard forecast, this means that a higher probability line must be contained within a lower probability line.
Step 4: Draw and edit your lines
Lines can be added to the map by first clicking the "Draw a Polygon" button in the top left corner of the map. You will notice the cursor change from a "grabber" to a "crosshair", which means that you're ready to start adding lines. Simply click on the map where you want to start adding a line, tracing out your area of interest. Click on the starting point again to close the polygon. A polygon can be edited by clicking the "Edit Layers" button, and one or more polygon can be deleted by clicking on the "Delete Layer" button and double clicking on the desired polygon.
Step 5: Submit your forecast
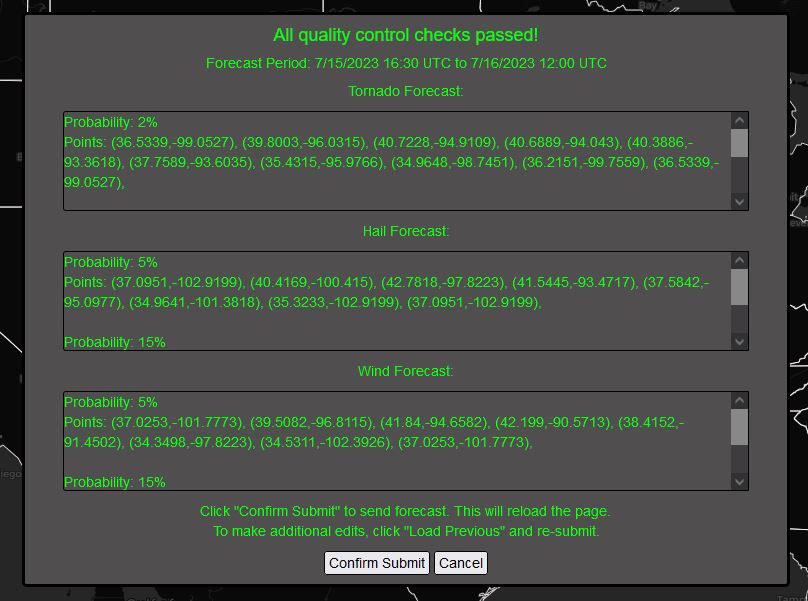
Once your forecast lines for each of the three hazards are complete you're ready to submit your forecast. This is done by simply clicking the green "Submit" button on the right side of the page. Prior to final submission, each hazard forecast will undergo a series of quality control checks:
- Point Exceedence Check (only 220 points are allow per hazard forecast)
- Geographic Bounds Check (makes sure all points are within the forecast domain)
- Continous Probability Check (ensures all higher probability points are contained within a lower probability polygon)
- Duplicate Check (ensures points are not contained within a polygon of the same probability value)
If any of these quality control checks are failed, an error message will display alerting the user to the problem. If all checks are passed, a green submission prompt will appear detailing the forecast valid period as well as the probability values and points contained in each hazard forecast. The user will then have to click "confirm submit" to finalize the forecast submission. Failure to do so will result in no forecast being recorded. The forecast submission page is then reloaded, but further edits are possible (see "Loading a previous forecast" below).
Loading a previous forecast
Forecasts that have been submitted prior to the 16:30 UTC deadline can be easily edited by clicking the "Load Previous" button. Once the desired edits are made, the forecast can be re-submitted as described above. After 16:30, clicking the "Load Previous" button will still load the latest hazard lines, but the forecast will be valid for the following convective day if re-submitted since the submission time is after the forecast deadline. Note that all forecasts are reset to "None" at the end of the target convective day, therefore a submitted forecast is only saved for a maximum of 20.5 hours.
Also worth noting is that you can track the status of your ongoing forecast in realtime via the Realtime Verification page.
Adding Map Data
Clicking the "Map Data" button on the right side of the Submit Forecast page will open the map options box. Here you can overlay state and county boundaries, the latest GOES-16 Channel 2 (visible) and Channel 13 (longwave IR) imagery, composite reflectivity imagery, and surface observations. (Satellite and radar imagery courtesy of IEM; surface observations courtesy of AWC.) Here you can also change the color of the state and county boundaries as well as the surface observation wind barbs.
Verification and Statistics
Forecast Verification
The guiding philosophy behind Armchair forecast verification is that each forecast should ideally maximize the number of "hits" (severe events that occur within a probability contour) while
minimizing the number of "misses" (severe events that occur outside of a probability contour) and the number of "false alarms" (points within a probability contour that do not experience
a severe weather event). Since severe weather events are climatologically rare for any one location on any given day (see "What do the lines mean?" below) a "correct null" forecast (no severe event is
forecast and no event occurs) is given considerably lower weight compared to hits, misses, and false alarms.
(Think about it this way: You want to forecast how likely it is that you win the lottery each time you buy a lottery ticket. Since winning the lottery is a stastically very
unlikely event, saying "I will not win the lottery" is a very easy thing to do! It is much more difficult to correctly identify when you will win the lottery.)
Forecast verification is performed as follows. Please note that this methodology remains in testing prior to the start of the tournament on 3/1/24 and is subject to further refinement.
- Step 1: The lat/lon of each tornado, hail, and wind LSR that occurs during the forecast period is found. (Note that each LSR must satisfy the severe criteria outlined above, and must have occurred during the 16:30 to 12:00 UTC period - LSRs that occur prior to 16:30 UTC or are reported after 12:00 UTC are ignored for verification purposes.)
- Step 2: These lat/lons are interpolated onto a 40-km grid over the CONUS using a similar methodology as the Practically Perfect method (see Gensini et al. 2020 for details). One exception is that the smoothing parameter is set to a small value (0.5) to reduce the influence of over-smoothing isolated severe reports.
- Step 3: All points on the verification grid with values at or above 0.5 are set to a value of 1.0 to signal a nearby severe weather event. All values below the 0.5 threshold are set to zero to signal no severe weather event.
- Step 4: The user's forecast is interpolated to the same 40-km grid.
- Step 5: For each hazard type:
- Step 5a: The number of missed events (LSR grid boxes with a value of 1.0 that are colocated with a forecast value of 0.0) are counted.
- Step 5b: The forecast grid is subtracted from the LSR grid. Since each probability threshold will have a unique difference value, the number of hits and false alarms can be quickly counted. The number of hits and false alarms at each probability threshold are scaled (i.e. multiplied) by the probability value. This is done for two reasons: 1) surveys have shown that false alarms tend to be preferred over missed events. By scaling the false alarms, we reduce their impact on the overall score. 2) This method rewards (penalizes) hits (false alarms) associated with higher probabilies more than hits (false alarms) associated with lower probabilities. (For example: 60% false alarms are considered worse than 5% false alarms.)
- Step 5c: The number of hits, misses, and false alarms are input into this equation:
Score = (hits - misses - false alarms)/(hits+misses+false alarms)
- Step 5d: The scores of all three hazards are averaged to give the daily score. For the tournament, a forecaster's composite score is simply a running sum of their daily scores.
It is worth noting that this verification methodology results in a daily score ranging from -1.0 (a perfectly bad forecast) to 1.0 (a perfect forecast). Forecasters who issue a "no severe" forecast automatically receive a daily score of 1.0 if no severe weather occurs. However, if severe weather does occur, their daily score will be -1.0 since they missed one or more severe events. Forecasters are not penalized for missing forecasts, but are encouranged to forecast as often as possible to accumulate the most points. Missing forecasts are reflected as a value of -9999 on the forecaster's profile page under "Yesterday's Statistics".
Two important notes: 1) The intensity of each severe weather event is not taken into consideration by this verification methodology. For instance, an EF-5 tornado would receive the same weight as an EF-0 tornado. What matters more is accurately forecasting the occurrence of a severe weather event for any given location. 2) Armchair forecasts are verified against a "rough log" of storm reports. This means that even if a severe event occurred during the forecast valid period, if an associated LSR is not issued by the local forecast office by 12:30 UTC then it is not counted towards verification. It is acknowledged that this is not ideal from a verification standpoint, and may impact tornado forecast verification the most since storm surveys typically are performed in the days following a tornado. However, this methodology was found to be the most expedient means to give forecasters rapid feedback on forecast performance.
Scoring Example
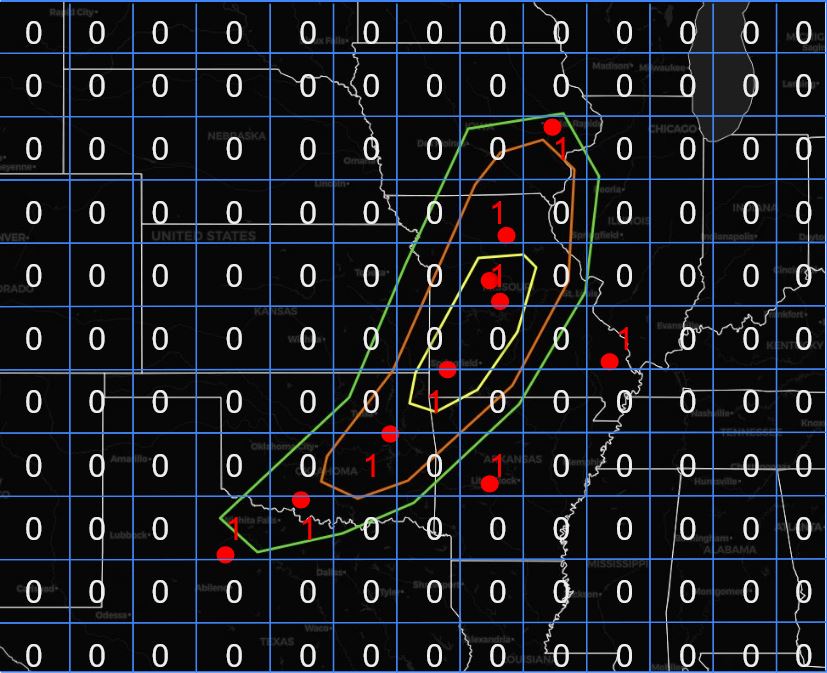
To illustrate the scoring system, we'll look at an example. For now let's focus on just the tornado hazard, but the procedure is the same for hail and wind. Let's say you have made the tornado forecast shown below:
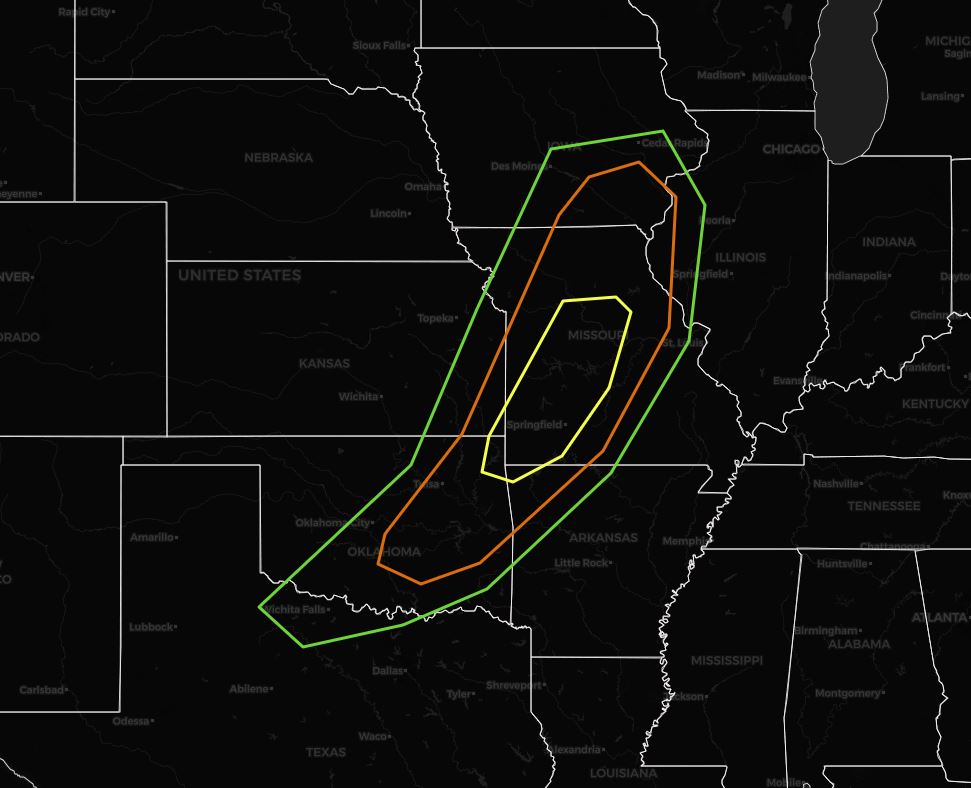
Following the steps outlined above, we'll begin with Step 1: collecting all tornado LSRs that occurred during the period 16:30 to 12:00 UTC during our valid forecast date.
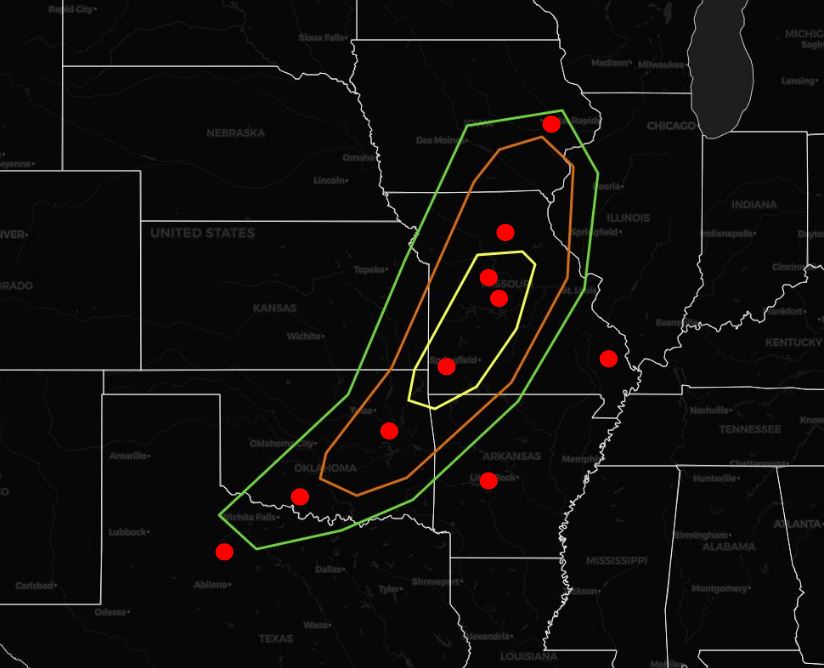
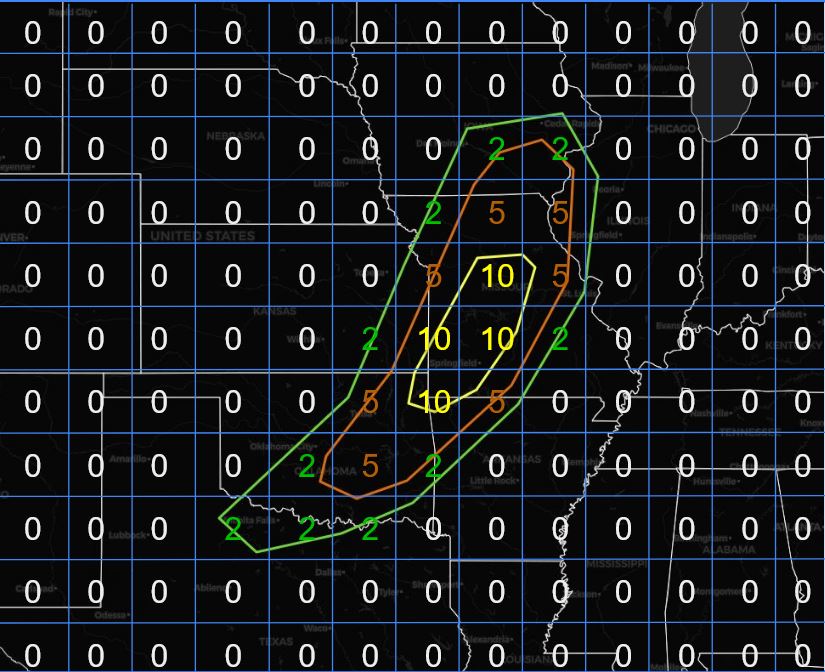
Steps 2 and 3: the tornado LSRs are interpolated and smoothed onto a 40-km grid. For simplicity, we'll skip over the "smoothing" portion of this step and focus on the result: a binary grid of ones and zeros that indicate where tornadoes did or did not occur on the grid. (Note that the grid shown here is not a 40-km grid, it is merely for illustation purposes.)
This brings us to Step 4: the forecast you made is interpolated to the same 40-km grid. Each grid box is given a probability forecast that a tornado will occur.
Step 5: Now that we have two grids with identical dimensions, we can take a difference between the two. Subtracting the forecast grid from the LSR grid gives us the following result:
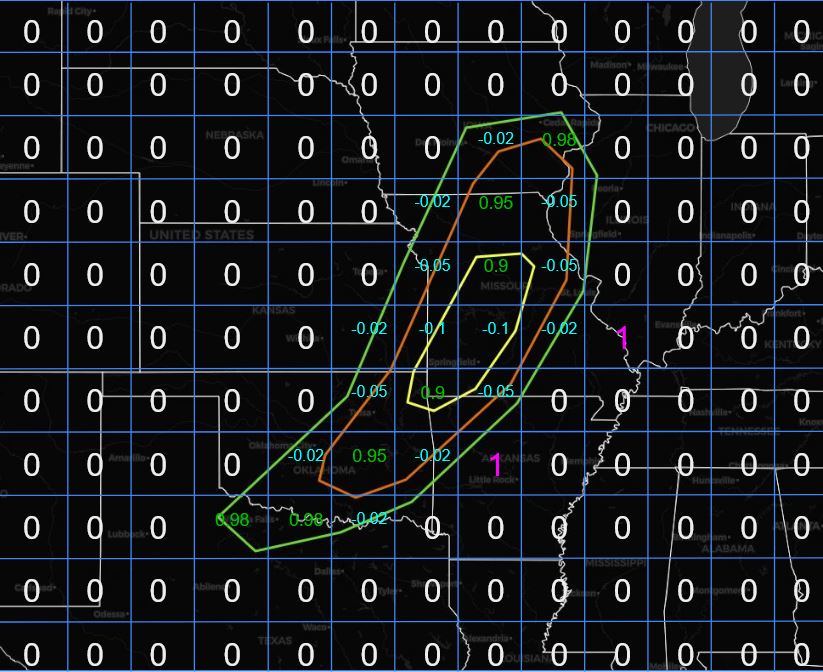
Notice that "misses" are denoted as 1s, "false alarms" are given as light blue negative values, and "hits" are given as green positive values. Now we can quickly count the number of misses (2) and hits (7). For the hits and false alarms, each number of hits/false alarms at each probability threshold (2%, 5%, 10%, etc...) is counted and multiplied by the corresponding probability value. Once these values are calculated, they are entered into the equation from Step 5c:
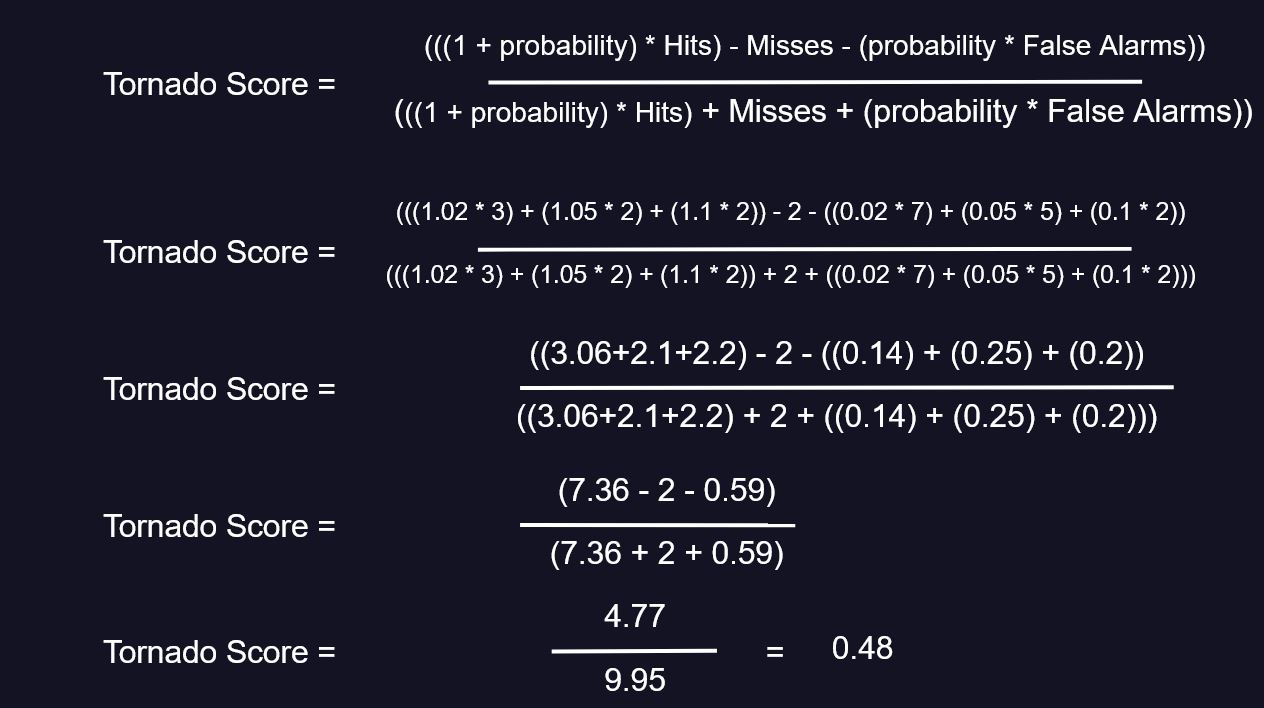
And this gives us our final tornado score! This example illustrates a couple of key concepts of this system. First, note that a grid box with multiple LSRs is given the same weight as a grid box with one LSR. This reduces the influence of over-reporting in urban areas. Additionally, note that false alarms aren't as detrimental to your score as missed events, and it is a combination of total false alarm area and the false alarm probability value that determine the false alarm penalty. As mentioned, this same procedure is repeated for the hail and wind hazards. The daily score is simply the mean of all three individual hazard scores. During the tournament period, the daily scores are accumulated for the total tournament score.
LSR Hits & Misses Table
In order to give forecasters a quick assessment of how their forecast performed, a table of LSR "hits" and "misses" is presented on both the realtime verification page and on the forecaster profile page. These hits (misses) are determined by counting the number of LSRs that occurred within (outside of) any probability line of the corresponding hazard (e.g. how many tornado events occurred within/outside of any tornado probability area). While helpful for a rough, first-order guess at how well a forecast performed (or is performing in realtime), "hits" and "misses" are not a robust metric for forecast performance and do not influence the daily score outlined above.
Forecast Calibration
A forecaster is considered "calibrated" when the observed frequency of an event is equal to the forecasted probability of said event over multiple forecasts. For example, let's say you are forecasting for a single grid point and make 100 forecasts. For each of these 100 forecasts you predict that there is a 5% probability for a tornado to occur. Of course, sometimes a tornado will occur, and other times no tornado occurs. If tornadoes occur on 20 out of the 100 forecasts (or 20% of the time), then your forecast of a 5% probability is not calibrated properly (you have a low bias). Likewise, if tornadoes occur on 2 out of the 100 forecasts (or 2% of the time), then you have a high bias. If tornadoes occur on 5 out of 100 forecasts (5% of the time), then your forecast of a 5% probability is well calibrated.
Your forecast calibration for each hazard is updated during the verification step of every forecast. It is a long-term statistic determined over all of your forecasts rather than the calibration of any single forecast. This metric is calculated by finding all grid points that were forecast at a certain hazard probability values (such as 5%, 10%, 15%, etc...), and then determining the frequency of hazard occurrence at those grid points. This frequency value is then averaged with all previous forecast calibration values to calculate the long-term calibration value, which is displayed on each forecaster's Forecast Calibration plot.
Tournament
Tournament Details
The Armchair forecasting tournament is a free-to-play competition to see who can consistently produce the best severe weather forecasts across the United States. The tournament is currently scheduled to take place from March 1st, 2024 to May 31st, 2024 with a winner announced in early June 2024. This period was chosen to capture the climatological peak of severe weather events across the CONUS. Forecasters already signed up on Armchair Forecaster will automatically be enrolled in the tournament, no further action is needed. Forecasters that sign up during the tournament period will still accumulate scores, but will not recieve credit for any missed days. Forecasters must submit the minimum required number of forecasts (30) to be eligible to win. Daily scoring for the tournament will remain the same as other times of the year, as outlined above. Additional future tournaments are possible and will be announced here and on Armchair Forecaster social media accounts.
Rankings and Jerseys
Forecaster rankings are deteremined by comparing accumulated daily scores during the tournament period. Taking after the famous bicycle race, the Tour de France, jerseys are awarded to forecasters at the top of the leaderboard to signify their superior forecsting skill during the tournament period. Jerseys are denoted on the leaderboard as well as on the leader's profile page. It is possible for one forecaster to hold multiple jerseys at one time. A breakdown of the jerseys is shown below:


- Yellow Jersey: Overall Leader (highest cumulative score)
- Red Jersey: Highest tornado cumulative score
- Green Jersey: Highest hail cumulative score
- Blue Jersey: Highest wind cumulative score
- Purple Jersey: Highest daily score
Whoever is wearing the yellow jersey at the end of the tournament period and has submitted at least 30 forecasts during the tournament period is declared the winner. In the event of a tie for the yellow jersey, the winner will be decided by comparing rankings in each individual hazard. For example, if Foreaster 1 and Forecaster 2 are tied for the Yellow Jersey, and Forecaster 1 is also wearing the Red Jersey while Forecaster 2 is not wearing any other jersey, then Forecaster 1 is the winner. If neither forecaster is wearing an additional jersey, then the forecaster who ranks higher in two of the three individual hazards will be declared the winner. If a tie persists, the forecaster with the highest daily score on the final day of the tournament (5/31/24) will be declared the winner. If a tie persists, two winners will be declared.
Tournament Prize
The winner of the tournament will receive a unique, Armchair Forecaster coffee mug. Please note that the final coffee mug design will be announced at a date prior to the 3/1/24 start of the tournament, and will be displayed on the tournament web page. This item cannot be exchanged for cash value. The winning forecaster must have a valid email on file to receive the prize.
Forecasting Philosophy
What do the lines mean?
We deal with probability all the time in our day-to-day lives whether we recognize it or not. For example, you might ask yourself "What is the chance that I'll run out of gas on my commute today?" after you forgot to fill up your car the night before. Or maybe you wonder "What are the chances that my runny nose is due to allergies rather than a serious illness?" during peak pollen season. Perhaps the most common example is trying to assess the chance that you'll roll snake eyes at the casino table or bust above 21 in a game of Blackjack. No matter how you encounter probabilities, we all follow the same general pattern: we assign a chance (or probability) that some event will or will not occur based on known information and prior experience.
Creating a convetive outlook is no different. Forecasters are tasked with assessing the current state of the atmosphere and utilize their understanding of meteorological concepts and past experience to assign a probability that a severe weather event will occur at a specific location. While assigning such probabilities on a point-by-point basis is possible, it's not very efficient to do so over a large geographic area like the lower 48 United States. Instead, forecasters at the SPC utilize probability lines to demark areas of probability. For example, a 10% tornado line means that there is a 1 out of 10 chance (10%) of observing a tornado within 25 miles of any point enclosed by the line. A general guideline for new forecasters is to ask yourself "based on the weather data available to me, what do I think the chance of a [tornado, hail stone, severe/damaging wind gust] is at this location?", and draw your probability lines based on the answer to that question. Pay attention to your verification statistics as this will help you calibrate correctly!
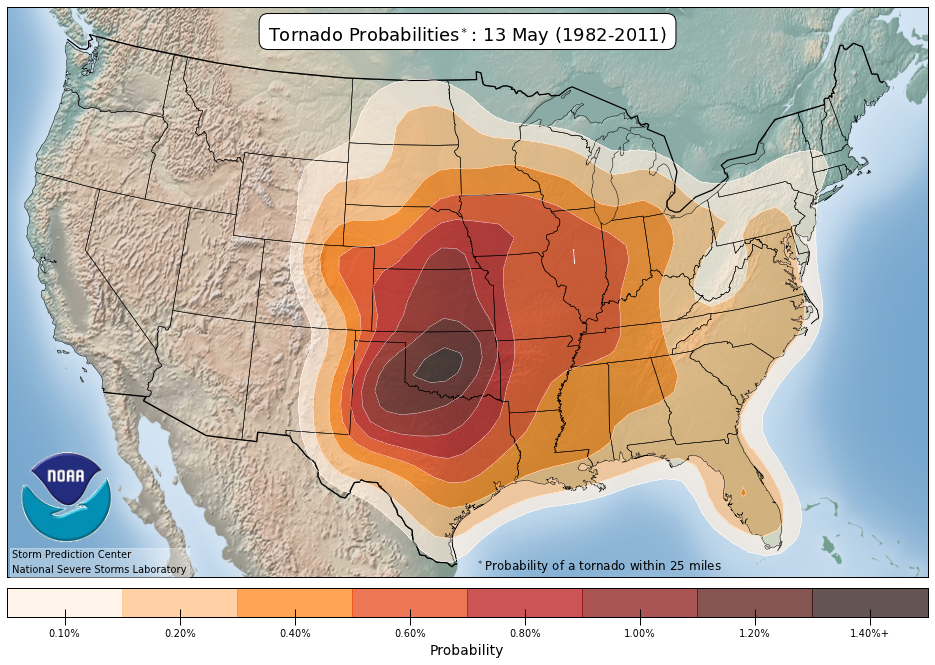
You may wonder why the probability lines are so low (i.e. a 2% tornado line); this is because the day-to-day probability that any severe weather event occurs is very low based on decades of severe weather climatological data. For instance, the climatological maximum tornado probability in the entire country occurs in mid-May over central Oklahoma (see below). The probability value? Just under 2%! Based on this information, forecasting a 2% chance of a tornado outside of central Oklahoma in mid-May is saying there is an above-climatological-average chance for a tornado to occur. Those curious for more details on the development of the hazard probability lines are referred to this paper on probabilistic forecasts at the SPC.
Should I use the SPC outlook?
The short answer: No.
The long answer:
SPC forecasters are widely regarded as some of the best severe weather forecasters in the country, if not the world. However, there are several key differences between the official SPC convective outlooks and Armchair forecasts that may make it undesirable to copy the hazard forecasts explicitly.
Among these reasons are the forecasting philosophy and legacy behind the product, what the convective outlook tries to communicate to the public, and documented biases in SPC forecasts.
The SPC began issuing early versions of the convective outlook in early 1953. Until the late 1990s and early 2000s, the convective outlook consisted of three categorical lines: "Slight", "Moderate", and "High" that denoted the relative threat for severe weather.
(Click here for more on SPC history.)
Although probability lines were introduced in the early 2000s, many forecasters continue to assess the severe weather threat in a categorical sense rather than a pure probabilistic sense. These philosophical
differences may influence how outlooks are created by forecasters and interpreted by the public.
For example, it is a common understanding among the meteorological community that the SPC's High Risk category is generally reserved for tornado outbreaks that feature multiple significant (EF-2+) tornadoes.
With this understanding in mind, the higher tornado probability lines might be withheld even if there was strong confidence that several weak, short-lived tornadoes would occur. In this way, SPC outlooks attempt to
also convey the potential intensity of a severe weather event (more formally, this is done by the "sig" lines in the convective forecast). As previously mentioned, Armchair forecasts do not account for potential intensity.
A 2018 study by Herman et al. assessed the skill of SPC convective outlooks in a pure probabilistic sense (akin to how Armchair forecasts are verified). This study noted several trends, including high skill in forecasting significant (EF-2+) tornadoes and severe/damaging winds, but poor skill in high-CAPE/low-shear environments and somewhat poor skill for areas outside of the central CONUS. While an Armchair forecaster could attempt to account for such biases while converting the SPC outlook to their own forecast, doing so is not guaranteed to yield an improved forecast.
Avoiding the SPC outlook is nearly impossible for today's severe weather enthusiasts; however, using the official outlook as a guideline for your own forecast deprives you of the opportunity to take deep dives into the data, use meteorological concepts, and learn from your own mistakes. In short - you won't improve! To avoid stagnation it is recommended that forecasters utilize the list of resources below to develop their understanding of the atmosphere and their forecasting techinques.
Other Considerations
Clip to the coasts
It is very rare to receive storm reports over the ocean. In fact, the official SPC outlook only extends to 12 miles off the U.S. coast! Because of this, it is recommended that forecasters trim their probability lines along the coast to reduce the amount of false alarm area and improve their verification scores. Similar considerations are recommended along the international borders.
No donuts!
Currently, the methodology for submitting and verifying forecasts does not allow for probability minimums within an outlooked area. In other words, you cannot create risk area "donuts". Users who attempt to submit "donut" forecasts will receive an error message.
Know your geography
If a tree falls in the forrest, but no one is around to report it, is it still considered a severe thunderstorm? Keep U.S. geography in mind. Where are the population centers, and conversely, the population dead zones? Which states have high-density mesonets? Knowing this information could help you reduce false alarm and improve your hit rate and overall verification scores.
Consider ongoing thunderstorms
About to submit your forecast at 16:30? Check the radar first! If there are ongoing strong to severe thunderstorms consider introducing higher probabilities immediately ahead of the ongoing convection. This should only be done if the time is close to the 16:30 deadline and you have completed a thorough environmental assessment and believe severe weather will occur within the next 1-3 hours. This may boost your verification scores if done correctly.
Forecasting Resources
Forecasting Tutorials
MetEdSPC/OU Severe T-storm Forecasting Class Lectures
OU SCAN Tornado Forecasting Lecture Series (feat. Rich Thompson)
NCEP/NWS Forecasts
Storm Prediction CenterNational Hurricane Center
Aviation Weather Center
Weather Prediction Center
Climate Prediction Center
NWS Forecast Offices
Real-time Observations
SPC Upper-Air ChartsUCAR Upper-Air Charts
COD Analyses
SPC Mesoanalysis
COD Satellite & Radar
UCAR GOES Imagery
Satsquatch Satellite Imagery
NOAA GOES Viewer
CO State RAMMB GOES Viewer
UCAR Surface Charts
SPC Surface Charts
AWC METAR Observations
Meso West Observations
Oklahoma Mesonet
Kansas Mesonet
Nebraska Mesonet
West Texas Mesonet
New York Mesonet
NDAWN (North Dakota Mesonet)
Current Sea Surface Temperatures
NOAA Nowcoast
Wx Watcher Realtime Map
Wx Watcher Subjective Analysis Charts
Wx Watcher Convective Impacts Map
Wx Watcher Soundings
SPC Soundings
Autumn Sky VWPs
Quad Weather Radar
Attic Radar
MRMS Operational Products
Lightning Maps Org
NWS LSRs
Model Guidance
COD Forecast ModelsPivotal Weather Models
Tropical Tidbits
HREF
Bufkit Meteogram Generator
Polar Wx
Warn-On-Forecast System (WOFS)
Nadocast
CSU ML Guidance
Model Initialization Errors
Miscellaneous
AFD ReaderPractically Perfect Hindcasts
OU FLASH
NOAA Weather Radio
NWS Snowfall LSRs
IEM Bot Product Monitor
KULM Doppler Radar
NSSL CLAMPS Realtime Data
xmACIS (ASOS Climatology)
Decoding METARs Guide
Decoding METARs One-Pager
METAR Symbols