How Good was Nadocast in 2024?
1/25/25 author's note -- A colleage pointed out that Nadocast's grid extends well into the Pacific and Atlantic oceans as well as the Gulf of Mexico, so the previous analysis inadvertently included forecasts in which the maximum probability was located off the U.S. coast. Obviously, this is important for verification purposes as no one lives on the oceans to report whether or not any tornadoes occurred. The statistics outlined below were re-run with a land mask to ignore all values not over the lower 48 land mass (so Mexico and Canada were also excluded). In general, the overall trends and takeaways remain the same, but the values have been updated to give a more accurate representation of performance.
An Active Year for Tornadoes
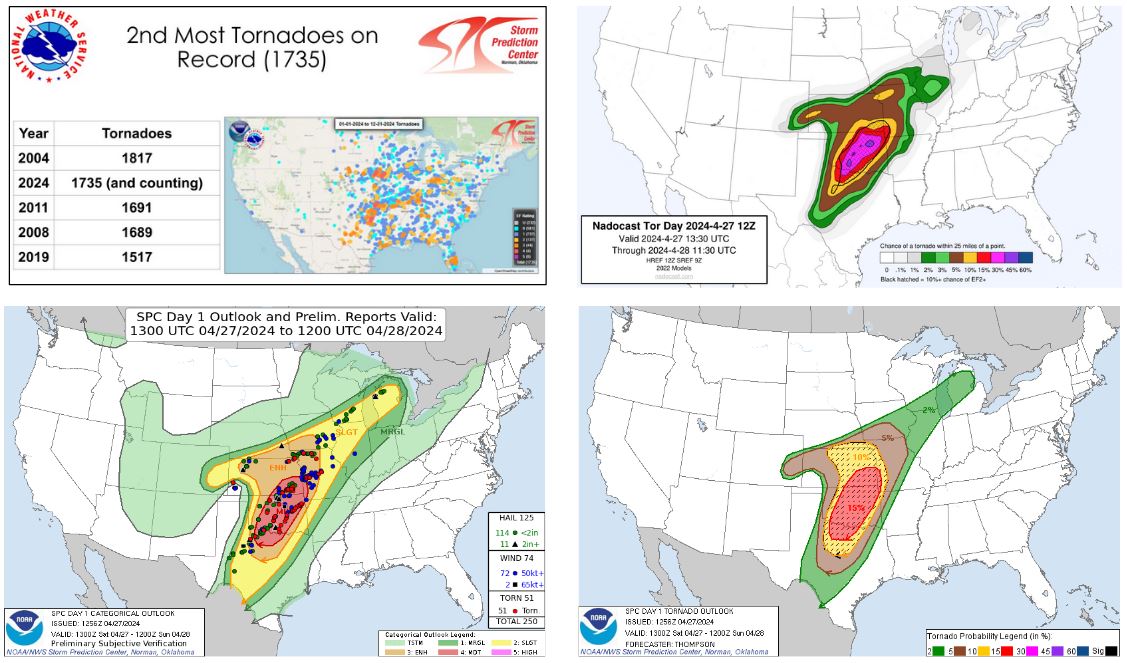
In a series of recent tweets the SPC annoucned that based on preliminary tornado counts, 2024 was the second most active year for tornadoes with an early count of 1735 tornadoes (2004 holds the record with 1817 tornadoes). Even when factoring in tendencies for increasing public reports and documentation of QLCS tornadoes, 2024 had the most EF-2+ tornadoes since 2011. That's quite impressive! What's more impressive is the performance of everyone's favorite tornado-forecasting AI model, Nadocast. In this quick post we'll higlight some interesting stats regarding Nadocast's performance over 2024 and what we can learn heading into 2025.

Methodology Notes
Before we get into the numbers, here's quick run down of how we're calculating our statistics. We're focusing only on the 12 UTC Nadocast tornado forecasts that are publicly available here. Each grib2 file was downloaded and the forecasts are interpolated onto a standard 40 km grid covering the CONUS (the same grid used to verify Armchair forecasts). Next, all tornado LSRs for each convective day were gathered from IEM. It is noted here that this dataset is not the official LSR dataset used by SPC or Storm Data, but these sources won't have complete 2024 data until sometime in mid 2025. Consequently, all stats presented here are subject to change to some degree as the final LSR dataset is QC'd. Regardless, the preliminary tornado LSRs are interpolated onto a binary (i.e. 1 or 0) 40-km grid. A second 40-km grid is created using the practically perfect method (the same method used to verify Armchair forecasts). Using the Nadocast forecast grid, the binary tornado grid, and the practically perfect tornado grid, verification statistics over the course of 2024 can be calculated. Unfortunatley, there was missing data on 52 days so we have a sample size of 314 verifiable forecasts.
Performance Stats
In general, missing tornadoes is considered bad, especially if you miss them routinely in your forecast. So how did Nadocast do in predicting tornadoes? The short answer is very well. In fact, when Nadocast made a "no tornadoes" forecast it was correct 87% of the time. So in other words, it only missed 13% of all tornado days in 2024! This is certainly a great statistic, but it comes with a catch: Nadocast has a tendency to over-forecast low-grade (2-5%) tornado probabilities.
On 70% of days in 2024, Nadocast issued a tornado forecast with a maximum tornado probability of 2% or higher. There were only 94 days (30%) when Nadocast made a "no tornadoes" forecast. On days when the maximum tornado probability was between 2-4.9% a tornado occurred only 43% of the time with a false alarm 56% of the time. This is a slight degredation compared to SPC forecasts over the same period, which had a 50/50 hit to false-alarm ratio. Similar statistics are outlined below:
Max probability of 5-9.9%:
Max probability of 10-14.9%:
Max probability of 15-29.9%:
Max probability of 30-44.9%:
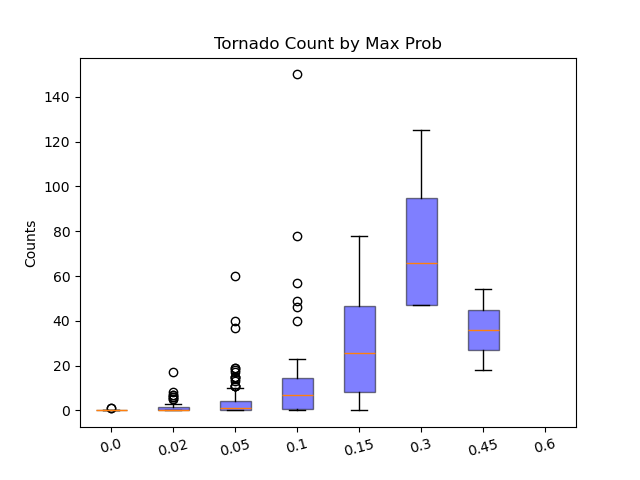
A graphical representation of these stastics is given below. Higher probability forecasts were made by Nadocast during 2024, but the sample sizes were simply too small to garner meaningful statistics (arguably, sample sizes of 3 and 11 days are also too small, but here they are anyways...). Once Nadocast starts producing maximum forecast probabilities above 5% the odds tip in favor of a tornado occurring. Even 10-14.9% tornado probabilities (which would translate to an Enhanced in the SPC categorical outlook) face only a 10% chance of a total false alarm. This is an impressive metric, even when compared to SPC's 10% tornado forecasts, which had a 0% false alarm percentage over the same period. Additionally, these statistics point out how rare it is to see Nadocast output probabilities above 15%, and the key takeaway is clear: if you see any risk probability above 15% in Nadocast you better have a *very* good reason for not expecting multiple tornadoes in your own forecast!

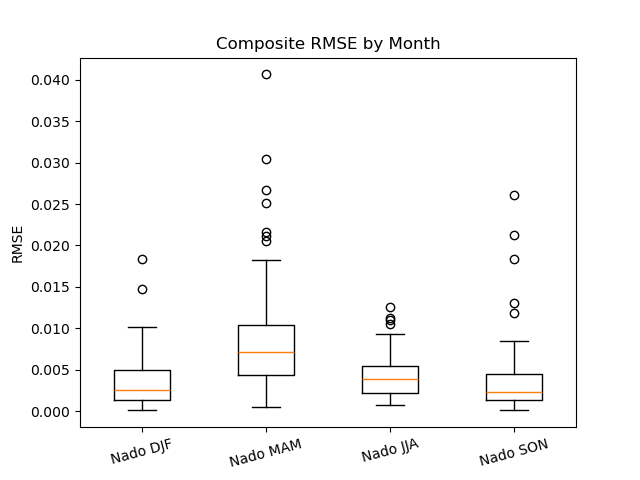
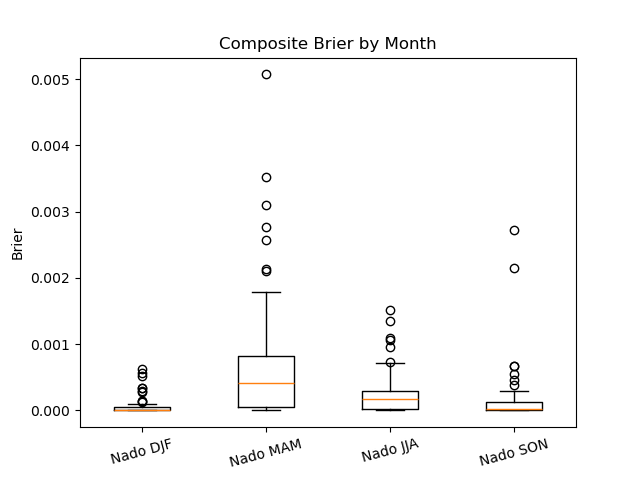
Tornado counts are useful information, but they don't tell us much about whether Nadocast can highlight the right locations for where tornadoes will occur. Nadocast's Brier score and RMSE were calculated to help guage spatial accuracy of the forecasts. They are also parsed out by season to identify any seasonal biases in 2024.


Surprisingly, Nadocast had higher Brier scores and higher RMSE (both of which indicate worse forecasts) during the spring months of March, April, and May with better forecasts during the fall and winter. This result may seem counterintuitive at first, but begins to make sense once we consider climatology. Although Nadocast contains literally thousands of inputs with varying weight, it's safe to assume that some degree of environmental information is incorporated into the forecast. In good, old-fashioned human-based tornado forecasting, a guiding heuristic is that better environments will generally support stronger supercells with a higher potential for producing tornadoes. Gensini and Bravo De Guenni (2019) highlight this relationship as well as the seasonal variation in tornado-supporting environments.
In general, March through May feature the best tornado environments of the year, and 2024 featured numerous days with excellent environments. Better environments can roughly translate into higher tornado probability forecasts. Again, Nadocast is a relatively black box, but let's make the rough assumption that it will place higher tornado proabilities where the input HREF members have the best convective signal. This assumes that the HREF members are correctly forecasting not only storm intensity, but also storm coverage and mode. Consequently, Nadocast may output high tornado probabilities, but is subject to displacement errors and storm mode failures (i.e. supercells were expected, but a squall line developed instead or vise versa). If Nadocast misses the tornado corridor, it will be heavily penalized in the Brier score and RMSE.
These results tell us that while Nadocast did very well at identifying days when tornadoes will occur, it struggled to pick out the right corridor at times in the spring. Conversely, it highlighted the correct corridors more accurately during the fall and winter months - the nocturnal outbreak in central OK on November 2, 2024 is a prime example.
Forecast Implications
Before we make any assertions about the long-term performance of Nadocast, there's a big caveat that should be mentioned. These statistics are based on only one year's worth of data. A preliminary look at Nadocast performance from June of 2022 through 2024 (not shown here) suggests that it might be possible to generalize these trends, but even then, multiple years' worth of data are needed to confidently identify long-term biases. This also assumes that the underlying HREF models going into Nadocast don't change with time, otherwise this could inadvertently introduce new biases.
With that caveat out of the way, here are some takeaways to consider as we head into 2025 and beyond. First off, the main takeaway should be that Nadocast is a very good tool. Yes, it has a tendency to over-forecast on the low end, but this may actually be a desirable feature depending on your risk tolerance (some folks may accept a higher false alarm rate for a higher probability of detection). However, once the maximum tornado probability exceeds 5% you might be looking at a greater than 50% chance of a tornado occuring during the forecast period. How well Nadocast picks out where the tornado (or tornadoes) will occur may be seasonally dependent. During the spring months, use Nadocast's corridor of maximum probability with some caution. Perform additional analysis to bolster your confidence that it's picking up on the right area. During the fall and winter months you can generally utilize the corridor of maximum probability with higher confidence.
hidden text!